Who can find out what food costs in New York?
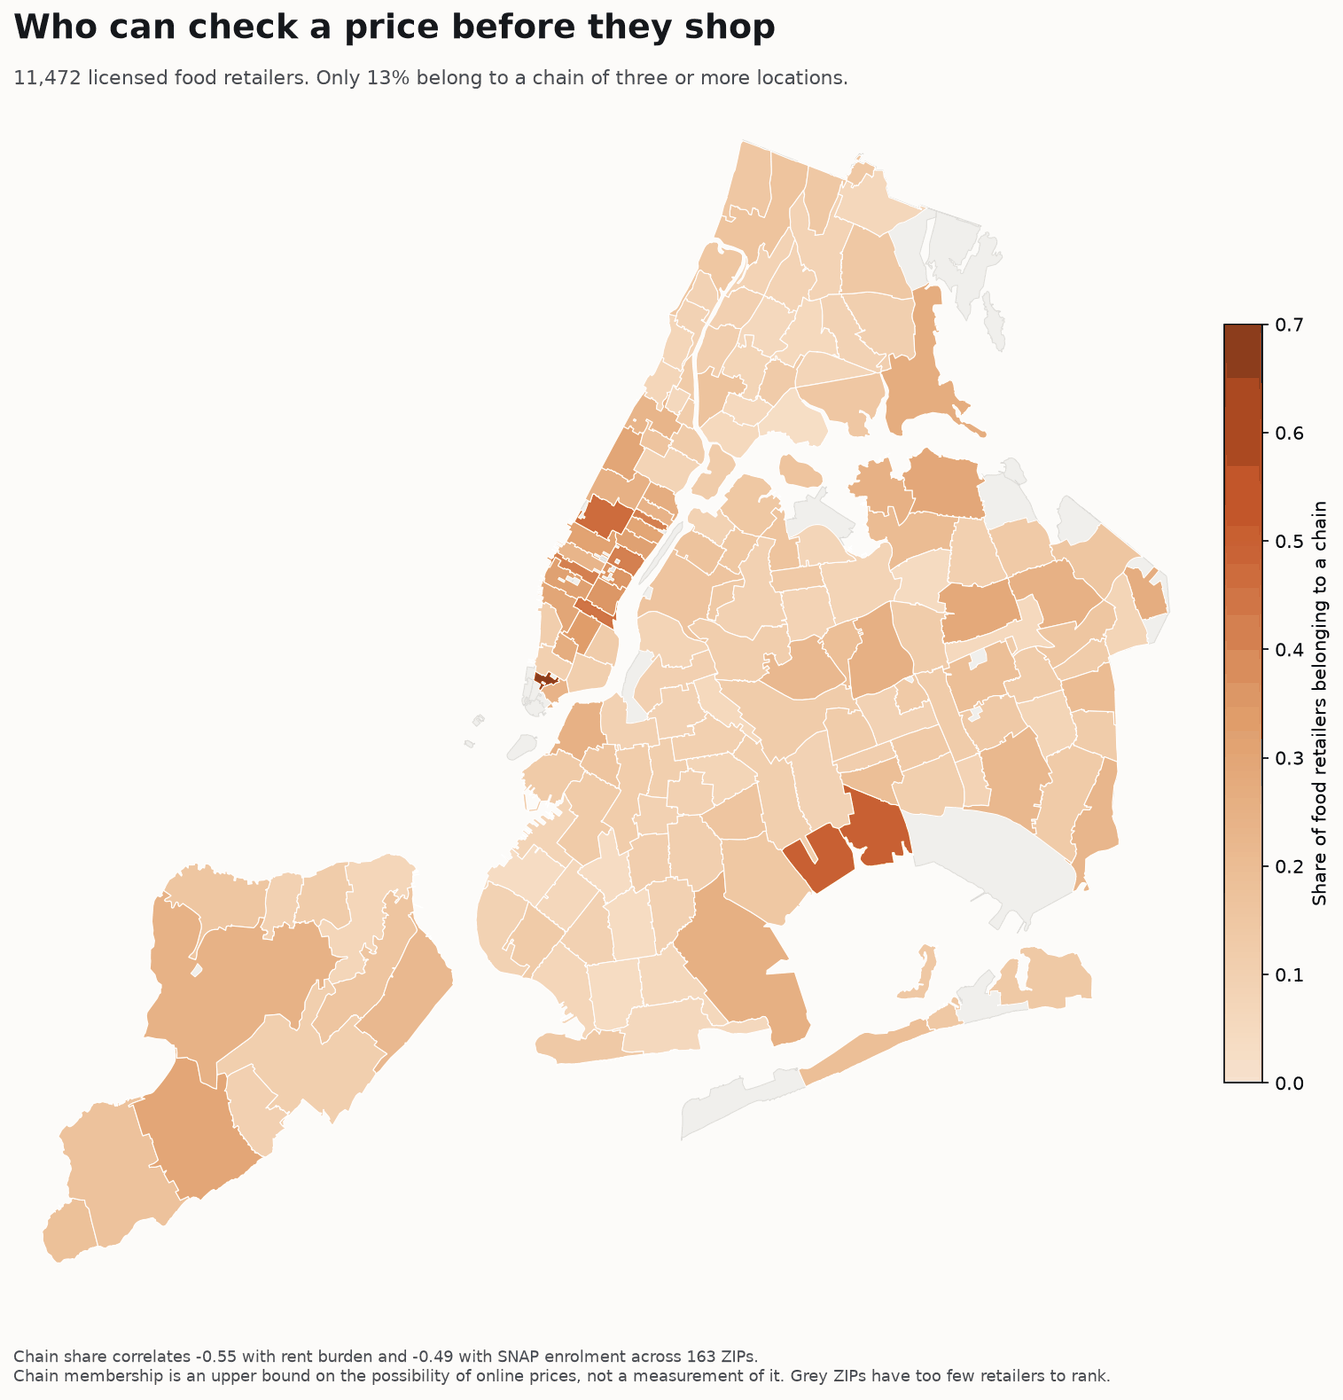
Not what groceries cost. Whether the price is knowable at all before you walk in. The city licenses 11,472 food retailers, and only 13% belong to a chain with the infrastructure to publish a price. That share tracks rent burden at −0.55. The neighbourhoods where people are most cost-burdened are the ones where prices are least visible in advance.
Underneath that sits the only store-level price data the city has, a 2019 Health Department survey of 163 supermarkets, mapped here and carried forward. And underneath that, a way to start measuring again.
The map of who is allowed to know
A store can only publish prices if it has the infrastructure to do so, and in practice that means belonging to a chain. 83% of the city's licensed food retailers carry a name used at exactly one address. There is no catalogue behind a bodega, so chain membership sets an upper bound on who could possibly check a price online.
That bound runs from 3% of retailers in Hunts Point and Sunset Park to 69% in Tribeca. Across 163 ZIP codes it correlates −0.55 with rent burden and −0.49 with SNAP enrolment, and the relationship holds between −0.51 and −0.62 as the minimum-store threshold is raised, so it is not an artifact of small areas.
Where prices are known, this is what they were
163 supermarkets, ten specified items, priced in person by Health Department staff between March and August 2019. Every dot is a store. The 2026 figures are those prices carried forward by the change in each item's federal price series, so they are a projection and not a shelf price.
Shopping from a point
Across the sample
How the numbers were made
- 2019 is measured. NYC DOHMH staff visited 163 supermarkets between March and August 2019 and recorded the price of ten specified items.
- 2026 is projected. Each item is multiplied by the change in its matching US Bureau of Labor Statistics average price series, from the March-August 2019 survey window to the latest published month.
- The series are matched to the product spec. The survey priced 90% lean ground beef and whole wheat bread, so the projection uses the lean beef and whole wheat series, not the generic ones. Using the generic series overstates the basket by several percent.
- Missing prices were imputed by DOHMH using multiple imputation. 5.4% of item prices are imputed, and 33% of stores have at least one.
Item specifications and factors
† matched to a different product. * same product, different unit basis.
What this cannot tell you
- It is not a current price. No store here has been visited since 2019.
- The sample is purposive, not representative. DOHMH chose stores by public transport accessibility and deliberately oversampled gentrifying neighborhoods. Borough figures describe the sample, not the borough.
- 163 stores out of 11,472 licensed food retailers in the city. Whole neighborhoods have no dot.
- Bodegas and delis are excluded entirely, and many New Yorkers shop in them.
- The projection assumes every store raised prices at the national rate for each item. That is certainly false at the individual store level. It is a comparison baseline, not a forecast.
- Two items are matched to a different product. Marked † in the table above. The survey priced 1% milk, and BLS publishes no low fat series, so whole milk stands in. The survey priced vine tomatoes, and the BLS series is field grown. For those two the projected rate is a substitute, not a measurement.
- Three more differ in unit basis. Marked * above. Bread was priced by the loaf against a per pound series, romaine by the head against per pound, and strawberries by the 1 lb container against a dry pint of about 12 oz. A rate of change mostly survives a unit difference, but it is not nothing.
- Three items are not comparable across stores. Where the preferred product was unavailable, surveyors recorded an alternative. That happened for 94% of orange records, 23% of lettuce and 18% of tomato, so per-item comparisons for those three mix different products.
Help re-measure it
Every price here traces back to one week of fieldwork in 2019. The projection exists only because nobody has been back. If you shop somewhere on this map, or somewhere that should be, you can price the same ten items in about ten minutes.
The field sheet uses the survey's own wording, so what you record is comparable to the baseline rather than a separate pile of numbers. Nothing is uploaded and no account is needed. It saves as you go and you export a file at the end.
Open the field sheetData
Everything here rebuilds from two public sources with one command and no API key. python3 scripts/build_data.py refetches the survey and the current BLS series and rewrites the file below.
- Price survey: nychealth/food-pricing-survey-nyc-2019, published with the Data in Brief article by Crossa, Cooperman, James, Ma and Baquero (2023).
- Price change: US Bureau of Labor Statistics average price series, via the public API.
- Prior work on this survey: the FEED-NYC dashboard from the CUNY Urban Food Policy Institute maps the same 2019 data by community district.